
Figuring out your content marketing return on investment is the surest way to prove its worth. It’s how you take content from a creative “nice-to-have” and turn it into a predictable revenue engine, showing leadership exactly how much money you’re making for every dollar spent.
Why Tracking Content ROI Isn’t Optional
Content marketing is a long game, but that doesn’t mean its financial impact is a mystery. We have to move past feel-good metrics like page views or social shares. Calculating your actual ROI is what gets budgets approved, fine-tunes your strategy, and proves your team’s value to the C-suite.

alt text: A marketing professional pointing at a large screen displaying charts and graphs, symbolizing the analysis of content marketing ROI data.
At its heart, the ROI calculation comes down to two things:
- Your Total Investment: This is everything you spend to get content out the door. Think creator salaries, freelance budgets, software costs, and any money spent on paid promotion.
- Your Financial Return: This is the revenue you can tie back to your content, whether it’s from new leads, direct sales, or even keeping existing customers around longer.
This simple shift changes the entire conversation. You stop asking, “How many people saw our blog post?” and start asking, “How much revenue did that blog post actually generate?” Suddenly, content isn’t just a line item on the expense sheet—it’s a serious business asset.
From Cost Center to Revenue Driver
Let’s make this real. Imagine you spend $10,000 on a series of expert webinars. That cost covers everything—the speaker fees, the webinar platform subscription, and the ads to promote it. After the dust settles, you track the attendees and discover they generated $50,000 in new sales over the next three months.
Just like that, you have a clear 400% ROI. You can now walk into any meeting and say, “For every dollar we invested in webinars, we got five dollars back.” That’s the kind of data that lets you make smart decisions, like confidently asking to double down on the webinar budget because you have proof it works. For a more general overview, it’s worth understanding how to measure marketing ROI across all your channels.
This mindset is the key. When you consistently track ROI, you learn to spot your winning content, cut the dead weight, and pour resources into the strategies that actually move the needle. And as you get better at this, you can even explore using AI for content creation to produce high-performing assets more efficiently, boosting your returns even further.
Actionable Takeaways
- Do a Quick Cost Audit: Take 15 minutes and list every tool and person involved in your last content campaign. This is your starting point for your “Investment.”
- Identify One Revenue Goal: Pick a single, clear action that generates revenue (e.g., a “Demo Request” form submission) and make it your primary tracking goal.
- Reframe Your Next Report: Instead of leading with “pageviews,” lead your next content report with the number of leads or sales generated.
The Essential Formula for Calculating Content ROI
So, how do you actually calculate the return on investment for your content? It all comes down to a surprisingly simple formula that cuts through the marketing fluff and gives you a hard number.
Here it is:
ROI = [(Return – Investment) / Investment] x 100
This equation is your best friend for turning performance metrics into a clear business case. A positive percentage means you’re in the green, while a negative one is a signal that something needs to change. Let’s dig into what goes into both sides of that formula so you can start using it yourself.
Tallying Up Your Total Investment
First, you need an honest count of every dollar you spent creating and promoting your content. It’s easy to overlook costs here, but being thorough is the only way to get a true picture of your ROI. Your “Investment” is much more than what you paid a writer.
Here’s a step-by-step process to get your total investment for a single campaign (e.g., a new e-book):
- List Production Costs: Sum the fees for writers, designers, and editors. If they are in-house, estimate their hourly rate and multiply by the hours spent.
- Example: Freelance Writer ($1,500) + In-house Designer (20 hours @ $50/hr = $1,000) = $2,500
- Add Tool Costs: Prorate the monthly cost of any software used. If your Ahrefs or Semrush subscription is $500/month and this project took up 10% of your team’s focus, add $50.
- Include Ad Spend: Add any budget spent on social media ads, search ads, or other promotions.
- Example: LinkedIn promotion budget = $500
- Sum It All Up: Add all the numbers together for your final “Investment” figure.
- Example: $2,500 (Production) + $50 (Tools) + $500 (Ads) = $3,050 Total Investment
Many small businesses use a mix of AI marketing tools to keep these processes moving and costs down.
Putting a Dollar Value on Your Return
Now for the other side of the equation: the “Return.” This is where you connect your content directly to revenue. The most straightforward way is to track direct sales, but more often, content generates leads that your sales team nurtures.
To figure out what a lead is worth, you can use a simple calculation: Lead Value = (Total Sales Revenue / Total Leads Generated).
Practical Example: If your business made $100,000 in revenue from 500 leads last quarter, you know that every new lead is worth about $200. This formula lets you assign a real monetary value to a blog post that brings in email sign-ups or a whitepaper that gets you demo requests.
This is where content-driven channels like SEO and email marketing really shine. On average, email marketing can deliver a staggering $42 for every $1 spent, and some studies show SEO can bring in a $22.24 return for each dollar invested. You can read more about these impressive marketing ROI benchmarks on firework.com.
Let’s Walk Through a Full Calculation
Imagine you just launched a four-part blog series.
1. Calculate the Investment:
- Freelance Writer Fee: 4 posts x $500/post = $2,000
- Stock Photos & Graphics: Monthly subscription = $50
- SEO Tool Usage: Prorated portion of your monthly plan = $100
- Paid Social Promotion: Ad budget to boost the posts = $350
- Total Investment = $2,500
2. Calculate the Return:
- The blog series generated 40 new qualified leads.
- Looking at your historical data, you know your lead-to-customer conversion rate is 10%.
- You also know the average lifetime value (LTV) of a new customer is $1,500.
- Return Calculation: 40 Leads x 10% Conversion Rate x $1,500 LTV = $6,000
3. Determine the Final ROI:
- ROI = [($6,000 – $2,500) / $2,500] x 100
- ROI = [$3,500 / $2,500] x 100
- ROI = 140%
There you have it. A 140% ROI. This means that for every $1 you put into this blog series, you got $2.40 back. That’s a number you can take straight to your boss.
Actionable Takeaways
- Create an “Investment Calculator” Spreadsheet: Build a simple template with line items for production, tools, and promotion. Use it for every new content project.
- Calculate Your Lead Value Today: Pull your last quarter’s revenue and lead numbers to find your current average lead value. This is your key to measuring return.
- Start Tracking One Content Type: Pick one format (e.g., blog posts) and commit to calculating its ROI for the next 30 days.
Choosing the Right Attribution Model for Your Content
Figuring out your content marketing ROI can feel like detective work. A customer might read a blog post one day, join your newsletter a week later, and finally buy after clicking an email link. So, which piece of content gets the credit?
This is where attribution models come in. An attribution model is a rule for assigning credit to the touchpoints a customer interacts with on their path to conversion. Picking the right one is essential for an accurate ROI.
First-Touch Attribution: The Origin Story
The First-Touch model gives 100% of the credit for a sale to the very first piece of content a customer engaged with. It answers, “What first brought this person into our world?”
This model is fantastic for understanding which content is a magnet for new audiences. If your main goal is to fill the top of your funnel, first-touch attribution gives you a clear picture of what’s working. For deeper insights, see our guide on inbound marketing lead generation.
- Actionable Insight: Use this model to identify your best “awareness” content. If a particular blog post consistently shows up as the first touch for new customers, create more content on that topic and in that format.
Last-Touch Attribution: The Final Push
The Last-Touch model gives all the glory to the final touchpoint right before the customer converted. This is the simplest to track and is often the default in platforms like Google Analytics. This model shines a light on your “closer” content—the stuff that seals the deal.
- Actionable Insight: Look at your last-touch reports to find your highest-converting content. These are your “money pages.” Optimize them with clearer calls-to-action, add customer testimonials, or create a video version to boost conversions even further.
Multi-Touch Attribution: The Complete Picture
Most customer journeys are messy. Multi-Touch attribution acknowledges this by spreading conversion credit across several touchpoints, giving you a more balanced view of how your content assets work together.
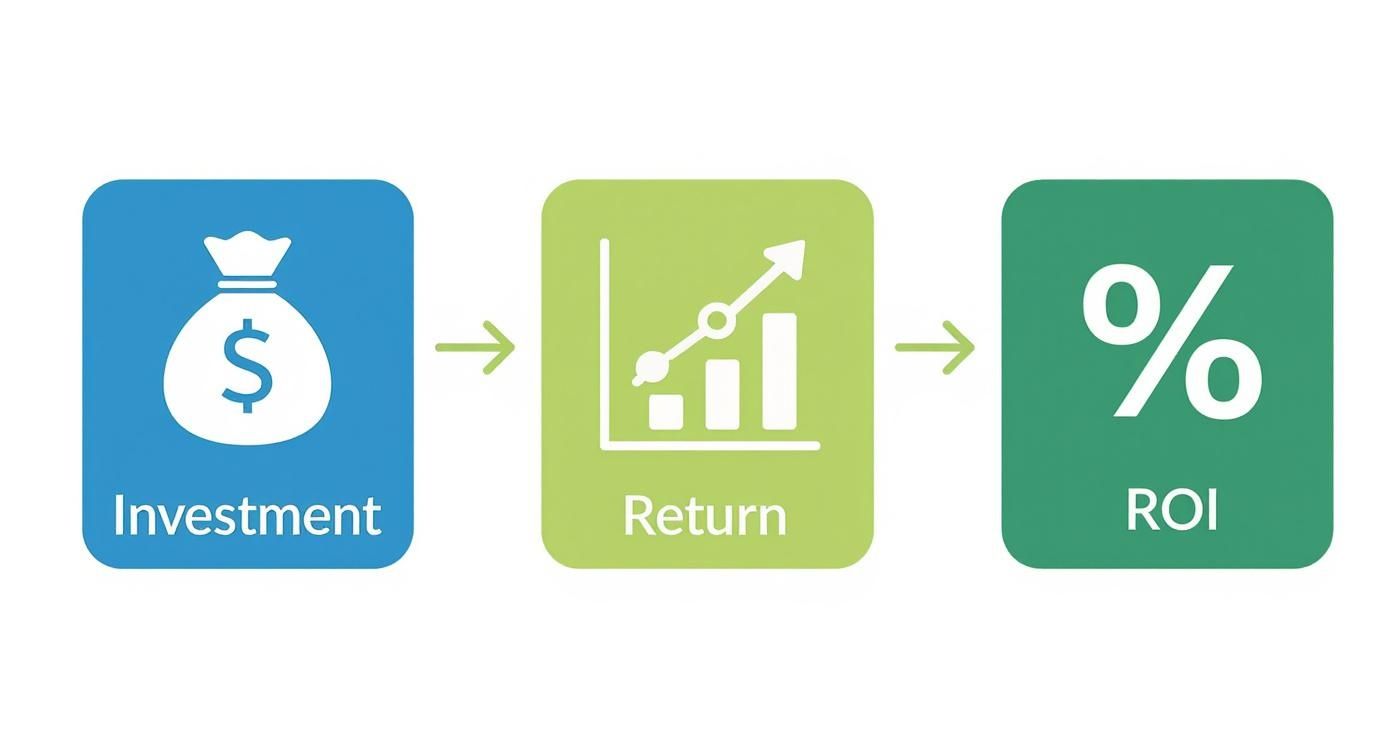
alt text: An infographic illustrating the content marketing ROI formula: ROI equals (Return minus Investment) divided by Investment, multiplied by 100.
Once you understand investment and return, you can apply a multi-touch model to see how different content contributes to that outcome. Popular models include:
- Linear: Gives equal credit to every touchpoint.
- Time-Decay: Gives more credit to touchpoints closer to the conversion.
- U-Shaped: Gives 40% credit to the first touch, 40% to the last, and splits the remaining 20% among the interactions in between.
To get more sophisticated, dive deeper into multi-touch attribution models.
- Actionable Insight: In Google Analytics, use the “Model Comparison Tool” to see how the perceived value of your content changes between Last-Touch and Linear models. This will reveal the “assisting” content you’ve been undervaluing.
Actionable Takeaways
- Start with Last-Touch: If attribution is new to you, start here. It’s the easiest to set up in Google Analytics and gives you a solid baseline.
- Review “Assisted Conversions”: Open your analytics and look at the “Assisted Conversions” report. This shows content that plays a supporting role, even if it’s not getting the final credit.
- Match Model to Sales Cycle: For long, complex sales cycles (B2B), a multi-touch model like Linear or Time-Decay will paint a more accurate picture.
- Use UTM Parameters Consistently: This is non-negotiable. For any attribution model to work, you must tag your campaign URLs with consistent UTM parameters. No tags, no data.
How to Set Up Your ROI Tracking System
To nail your content marketing return on investment, you need a system. Building a solid tracking workflow turns abstract data into clear, actionable insights. Let’s walk through building that system step-by-step.
Step 1: Define Your Core Content Goals
Before you track anything, know what you’re aiming for. Your goals must reflect your company’s objectives. Are you trying to generate qualified leads or drive direct e-commerce sales? Get specific. Fluffy objectives like “increase brand awareness” are useless for calculating ROI.
Action: For your next campaign, define one primary, measurable goal.
- Bad Goal: “Get our new e-book seen by more people.”
- Good Goal: “Generate 150 qualified leads from our new e-book, tracked via form submissions on the landing page.”
Step 2: Configure Your Analytics Tracking
Once you know your goals, tell your analytics platform how to spot them. For most, that means setting up conversions in Google Analytics 4 (GA4). This is how you flag the user actions that matter.
How to Set Up a Basic Conversion in GA4:
- Create a “Thank You” Page: After a user submits a form (e.g., for a newsletter or e-book), redirect them to a unique confirmation page like
yourwebsite.com/thank-you. - Go to GA4 Admin: Navigate to
Admin > Data display > Events. - Create an Event: Click “Create event.” Name your event (e.g.,
lead_generated). - Set the Condition: Set the condition to
page_locationcontains/thank-you. - Mark as Conversion: Go to
Admin > Data display > Conversionsand toggle your new event (lead_generated) on as a conversion.
Now, every time someone hits that page, GA4 will count it as a conversion.

alt text: The Google Analytics 4 dashboard displaying reports on goal completions, conversions, and user engagement metrics.
Step 3: Implement Consistent UTM Parameters
How do you know if a lead came from your email campaign or a LinkedIn post? Urchin Tracking Module (UTM) parameters. These are tags you add to URLs that tell your analytics platform where each click originated. Without them, it’s impossible to calculate an honest content marketing return on investment.
Action: For your next social media post, use Google’s Campaign URL Builder to create a tagged link.
- Website URL:
https://yourwebsite.com/new-blog-post - Campaign Source:
linkedin - Campaign Medium:
social - Campaign Name:
q4_content_launch
Your final URL will be:https://yourwebsite.com/new-blog-post?utm_source=linkedin&utm_medium=social&utm_campaign=q4_content_launch
Step 4: Integrate Your CRM with Analytics
Your analytics platform tells you what happens on your website. Your Customer Relationship Management (CRM) system—like HubSpot or Salesforce—tells you what happens after that lead comes in. Integrating the two connects the dots between the first click and their final value as a customer.
Action: If your CRM isn’t connected to your analytics, make it a priority. This integration lets you answer questions like, “Which blog posts generate our highest-value customers?”
Step 5: Create a Centralized Reporting Dashboard
Stop wasting time pulling reports from a dozen different places. Use a tool like Looker Studio to build a centralized dashboard that puts all your key metrics in one spot.
Action: Build a simple dashboard in Looker Studio with just three widgets:
- Sessions by Source/Medium
- Total Conversions (from the goal you set up in Step 2)
- Conversion Rate
This saves time and makes it easier to share performance updates. Many teams even explore how to automate social media posts to streamline distribution, leaving more time for analysis.
Actionable Takeaways
- Define One Key Goal: Before your next campaign, pick a single, primary conversion goal and set it up in Google Analytics (e.g., “Newsletter Signup”).
- Use a UTM Builder: For your next three social media posts or emails, use Google’s Campaign URL Builder to tag every single link. Make it a habit.
- Connect Your CRM: If it’s not done already, make integrating your CRM with Google Analytics your top priority. This is where you link content to sales.
- Build a Simple Dashboard: Open Looker Studio and create a basic dashboard with just three metrics: Sessions, Goal Completions, and Revenue by Source/Medium. Start small.
Tools & Resources
- Google Analytics 4: The essential platform for tracking website traffic and conversions.
- Google Campaign URL Builder: A free tool for creating properly tagged UTM links.
- Looker Studio: A powerful (and free) data visualization tool for building custom ROI dashboards.
Further Reading
- Learn more about setting up conversions in GA4 from the official Google Analytics Help Center.
Industry Benchmarks and What to Expect
You’ve run the numbers and have your content marketing ROI. But what does that percentage mean? A 150% ROI might feel like a win, but is it good, great, or average? Without context, a number is just a number. Knowing how you stack up against your industry transforms that number into a strategic tool.
Why Context Is Everything
A “good” content marketing ROI isn’t universal. It shifts wildly based on sales cycle length, customer lifetime value (LTV), and average price points. A SaaS company with recurring high-margin subscriptions will have a different ROI profile than an e-commerce store built on high-volume sales. Comparing your performance to relevant benchmarks helps you set achievable targets and gives you powerful context when reporting to leadership.
Practical Example: You work at a healthcare tech company and your content ROI is 450%. On its own, that sounds decent. But when you see the industry average is 470%, you now have a clear, data-backed goal: find efficiencies to close that 20% gap. This changes the conversation from “We’re doing okay” to “Here’s how we plan to become above-average.”
A Comparative Look Across Key Sectors
Technology and SaaS tend to lead the pack with a 680% average ROI and an eye-watering 890% for top-quartile performers. E-commerce isn’t far behind, posting a 620% average and 840% in the top tier. Other sectors like financial services average 540%, professional services hit around 590%, and healthcare typically sees an average ROI of 470%. You can dig deeper into these industry-specific content marketing stats..
Content Marketing ROI Benchmarks by Industry
This table offers a comparative look at average and top-quartile ROI percentages across key industries. Use it to gauge where your results land and set realistic goals.
| Industry | Average ROI | Top Quartile ROI |
|---|---|---|
| Technology / SaaS | 680% | 890% |
| E-commerce | 620% | 840% |
| Professional Services | 590% | 780% |
| Financial Services | 540% | 720% |
| Healthcare | 470% | 630% |
If you’re below average, it’s a signal to re-evaluate your content strategy. If you’re hitting the average, your next mission is clear: figure out how to break into that top quartile.
Actionable Takeaways
- Find Your Baseline: Pinpoint your industry in the table. That average ROI is your new baseline for success.
- Segment Your Reporting: Always include the relevant industry benchmark when presenting your ROI. It provides crucial context for leadership.
- Hunt for High-LTV Content: If your ROI is lagging, find the content that attracts your highest-value customers and double down on those topics and formats.
- Set Tiered Goals: Ditch the single target. Set three: a minimum goal (beat last quarter), a target goal (hit your industry average), and a stretch goal (reach the top quartile).
Tools & Resources
- SparkToro: Use this audience research tool to understand what your industry’s audience wants, helping you create content that drives higher ROI.
- Ahrefs: Use its Content Explorer to see what’s working for your competitors and deconstruct their success.
Further Reading
- For a deeper dive into performance metrics, check out this collection of Content Marketing Statistics from Semrush.
Common Pitfalls to Avoid When Measuring ROI
Measuring your content marketing return on investment can be tricky. Even with the best formulas, a few common mistakes can lead to bad strategic decisions. Research shows only 29% of marketers feel they’re effectively measuring content ROI. Let’s walk through the most common mistakes and how to sidestep them.

alt text: A magnifying glass highlights a bar on a chart marked with a red ‘X’, symbolizing the identification of a common mistake in ROI analysis.
Ignoring the Long-Term Value of Content
One of the biggest traps is an obsession with immediate conversions. Top-of-funnel content, like educational blog posts, rarely works that way. It’s a slow burn—it builds trust and assists in future sales in ways a simple last-touch model will never see.
Practical Example:
You publish an in-depth guide, “The Ultimate Guide to Project Management for Startups.” In its first month, it generates zero direct sales. A last-touch ROI calculation would label it a failure.
But over the next six months, 50 people who read that guide eventually sign up for your software. The guide assisted 50 sales, but a narrow focus on immediate ROI would have missed its contribution entirely.
Action: Go into Google Analytics and look at the “Assisted Conversions” report. Identify a top-of-funnel blog post that shows up frequently. This is proof of its long-term value.
Forgetting to Account for All Costs
It’s easy to just count the obvious costs, like a freelance writer’s invoice. But this gives you an inflated ROI. The real investment includes every resource used.
Actionable Checklist for Total Investment:
- Prorated salaries for in-house writers, editors, designers.
- A portion of your monthly subscriptions for SEO tools, design software, and schedulers.
- Any budget spent on ads to promote the content.
- A small percentage of general business overhead.
An accurate ROI demands a brutally honest accounting of all costs. If you overlook “hidden” expenses, you’re not measuring your true return.
Neglecting Content’s Impact on Retention
Getting a new customer is far more expensive than keeping one. Yet, most ROI models focus only on acquisition and ignore content’s massive role in customer retention. Helpful tutorials, onboarding guides, and expert webinars help current customers get more value from your product, which reduces churn and increases their lifetime value (LTV).
Action: Survey your customers who recently renewed their subscriptions. Ask them if they’ve engaged with your blog, help center, or webinars in the past six months. This qualitative data helps connect content to retention.
Actionable Takeaways
- Audit Your Hidden Costs: Open a spreadsheet and list every tool, salary, and subscription that touches your content process. This is your new, accurate “Investment” baseline.
- Review Assisted Conversions: In Google Analytics, pull up the “Assisted Conversions” report. Find one piece of content that helped a sale, even if it didn’t get the final credit.
- Track a Retention Metric: Start looking at how your content impacts customer churn. Survey customers or analyze usage data to see if people who engage with your help guides are more likely to stay.
- Adopt a Broader View: Shift your team’s mindset from “Did this post convert today?” to “How is this post contributing to the entire customer journey over the next quarter?”
Tools & Resources
- Google Analytics: Use the Model Comparison Tool to see how different attribution models (First-Touch, Last-Touch, Linear) change the value assigned to your content.
- Your CRM (e.g., HubSpot, Salesforce): Dig into individual contact records to manually trace a customer’s journey and see all the content touchpoints they interacted with, both before and after becoming a customer.
Further Reading
- Learn more about a holistic approach with this guide on customer journey analytics. It can help reveal the true, often hidden, impact of your content.
Actionable Takeaways
Moving from guessing what works to knowing what works is the whole point of measuring content marketing ROI. We’ve covered the formulas, models, and frameworks. Now, it’s time to put it into practice.
Here are five high-impact steps you can take right now.
- Calculate Your Total Content Investment: Get brutally honest about your costs. Open a spreadsheet and log every content-related expense from the last quarter, including prorated salaries, tool subscriptions, and ad spend. This final number is the ‘Investment’ in your ROI formula.
- Set Up Conversion Tracking for One Key Goal: You can’t measure what you don’t track. Log into your Google Analytics account and create one new conversion goal that ties directly to a business objective, like tracking “Demo Request Form Submissions.” This is your first step toward measuring the ‘Return’.
- Implement a Simple Attribution Model: You don’t need a flawless multi-touch model yet. Start by reviewing the ‘Last-Touch’ conversion data already in your analytics platform. It’s a great starting point for connecting content to a conversion.
- Tag Your Next Campaign with UTMs: This one is non-negotiable. Before you launch your next email or social campaign, tag every single link using a free UTM builder. This feeds clean, source-specific data straight into your analytics. No more guessing.
- Review One ‘Assisted Conversion’ Path: Dive into your Google Analytics “Assisted Conversions” report. Find one customer journey where a blog post showed up early, even if it didn’t get the final credit. This immediately highlights the long-term value of your top-of-funnel content. For those looking to integrate technology more deeply, an understanding of artificial intelligence in business can reveal new ways to track and optimize these complex journeys.
Ready to accelerate your content creation and streamline your ROI tracking? RichlyAI Hub offers a powerful suite of AI tools to generate high-quality text, images, and marketing copy, helping you produce more high-performing content in less time. Get started for free today.